
Educational Resources for Traders
Browse through TheCalculatedTrade’s curated collection of trading courses, guides, and market insights.
Daily Technical Analysis
Our Daily Technical Analysis delivers clear, actionable market insights on top forex pairs, crypto assets like Bitcoin and Ethereum, and commodities such as Gold — all tailored for both beginners and seasoned traders.
Showing 1-10 of 44 educational posts
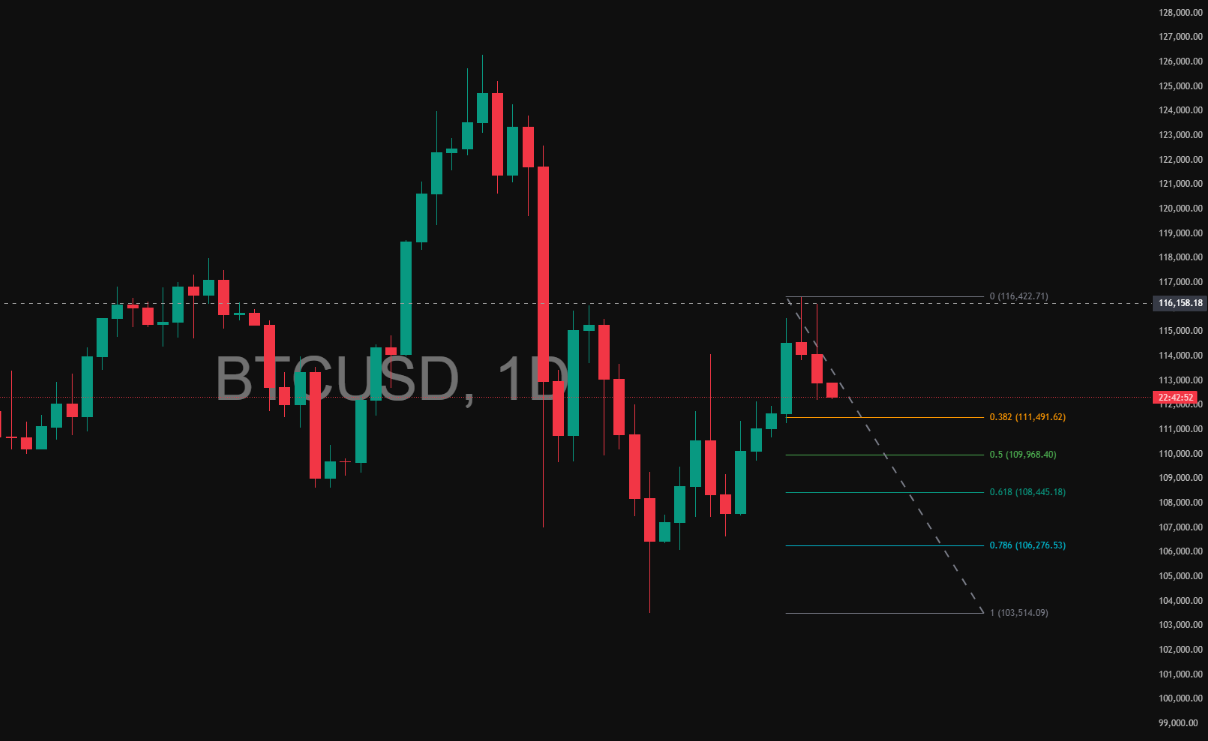
Mid-Week Bitcoin Analysis: Key Levels to Watch Ahead of the Fed Rate Decision
Bitcoin is consolidating near key support as traders await the Fed’s rate decision. Technicals show BTC testing critical Fibonacci levels, while macro factors could provide the spark for the next directional move. Whether it’s a rebound or deeper correction, this week’s price action will likely set the tone for November.
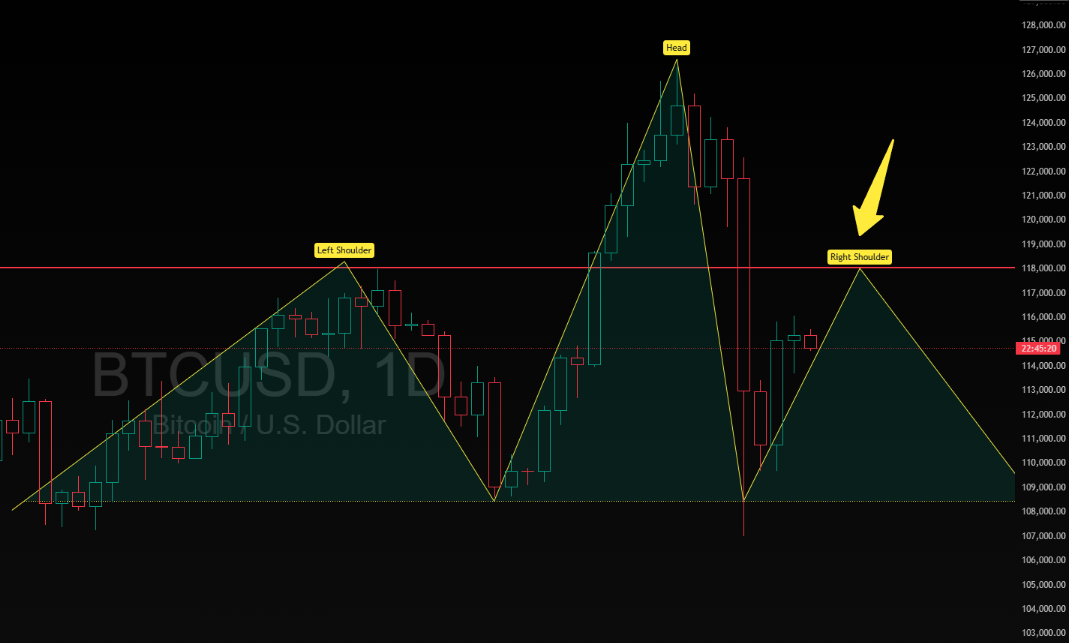
Bitcoin Head & Shoulders Forming — But Here’s How the Bulls Can Invalidate It!
If Bitcoin fails to hold above $115,000, bears could take control, confirming a Head and Shoulders breakdown. However, a daily close above $118,000 could invalidate the pattern and open the path toward $122,000–$125,000 once more.
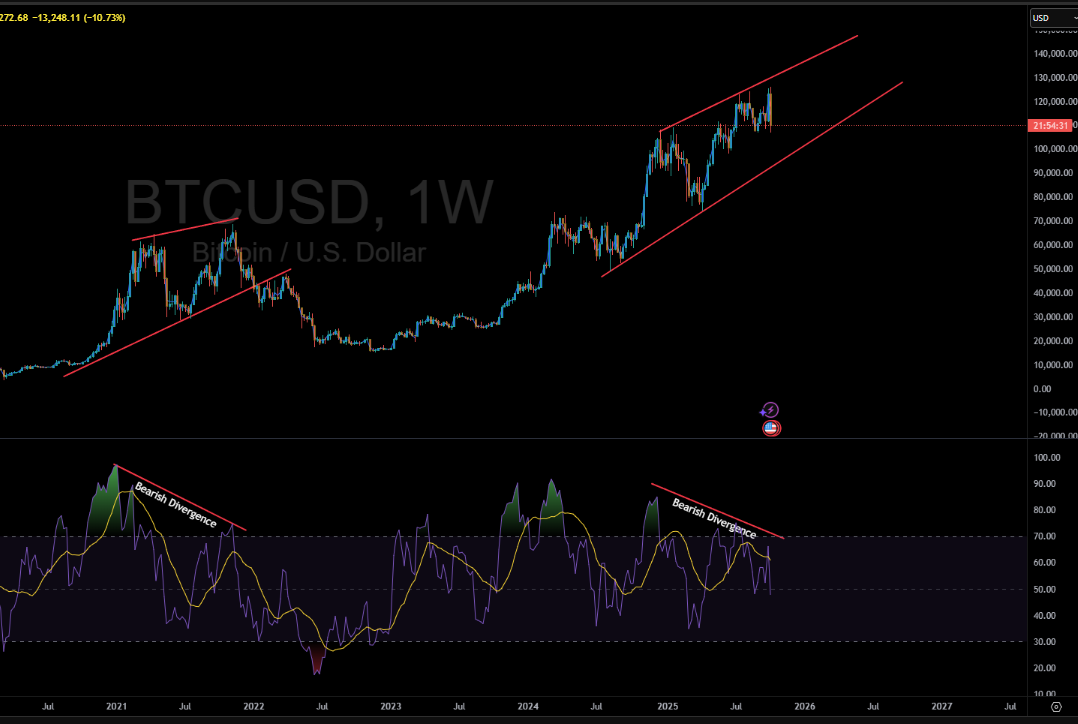
Bitcoin Weekly Chart Analysis (BTC/USD): Bearish RSI Divergence Signals a Possible Correction Ahead
Bitcoin’s weekly chart shows a rising wedge and bearish RSI divergence similar to the 2021 top. Will BTC correct before continuing higher? Read this in-depth analysis comparing current price action with the previous Bitcoin cycle.
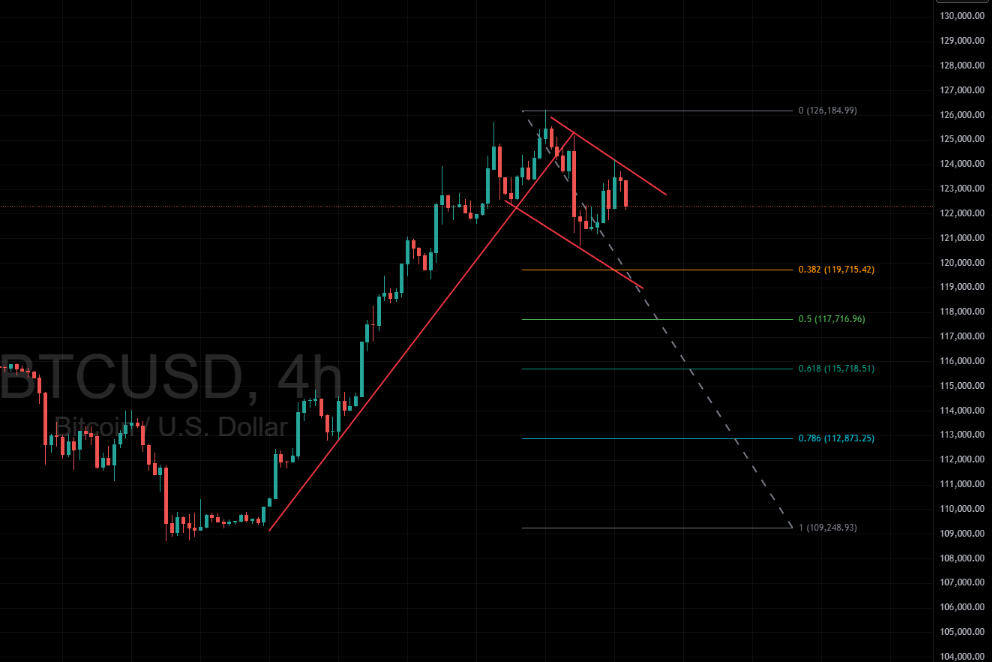
Bitcoin Price Analysis: 4-Hour Chart Signals Possible Drop Toward $115K After Wedge Breakdown
Bitcoin’s structure suggests a short-term retracement phase within a broader bullish context. Bears may have an opportunity for a quick downside play, but bulls should watch for a breakout confirmation before re-entering long positions.
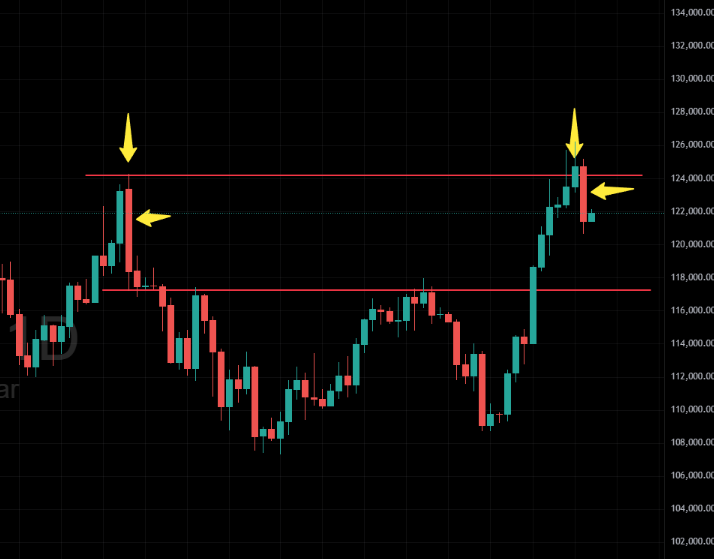
Bitcoin Battles Resistance at Record Highs — Is a Pullback Brewing?
On your daily chart, Bitcoin recently approached a strong resistance zone (marked by the red horizontal line) twice (yellow arrows), and again got rejected near that level — highlighting that the previous high is acting as stiff supply.
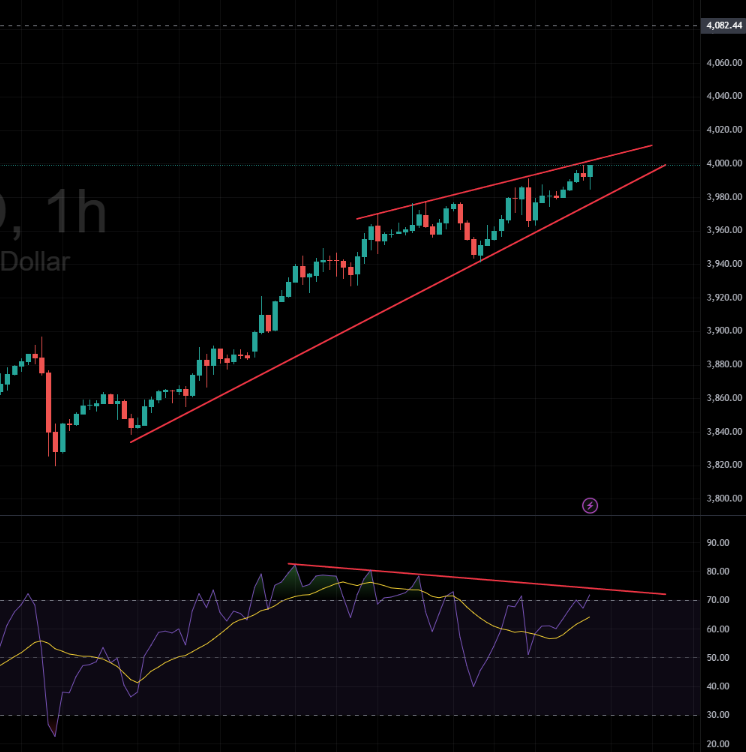
Gold Price Analysis: Rising Wedge and RSI Divergence Signal Possible Reversal
Outlook: Short-term bias turns cautiously bearish, pending confirmation of a wedge breakdown.
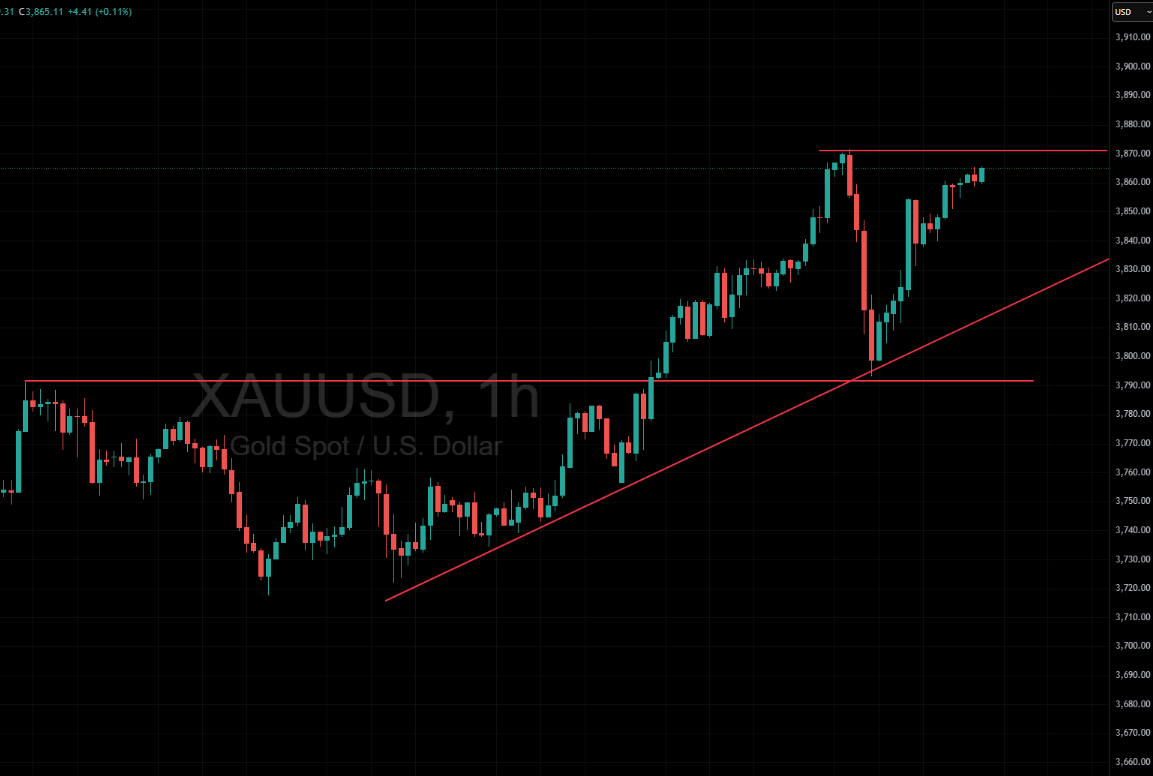
Gold Price Forecast Today: XAUUSD Breakout or Pullback Near $3,870 Resistance
Gold is consolidating below a key resistance. A breakout could fuel another leg higher, while a failure may bring a healthy pullback to retest support. Traders should watch $3,870 closely as today’s pivot level.
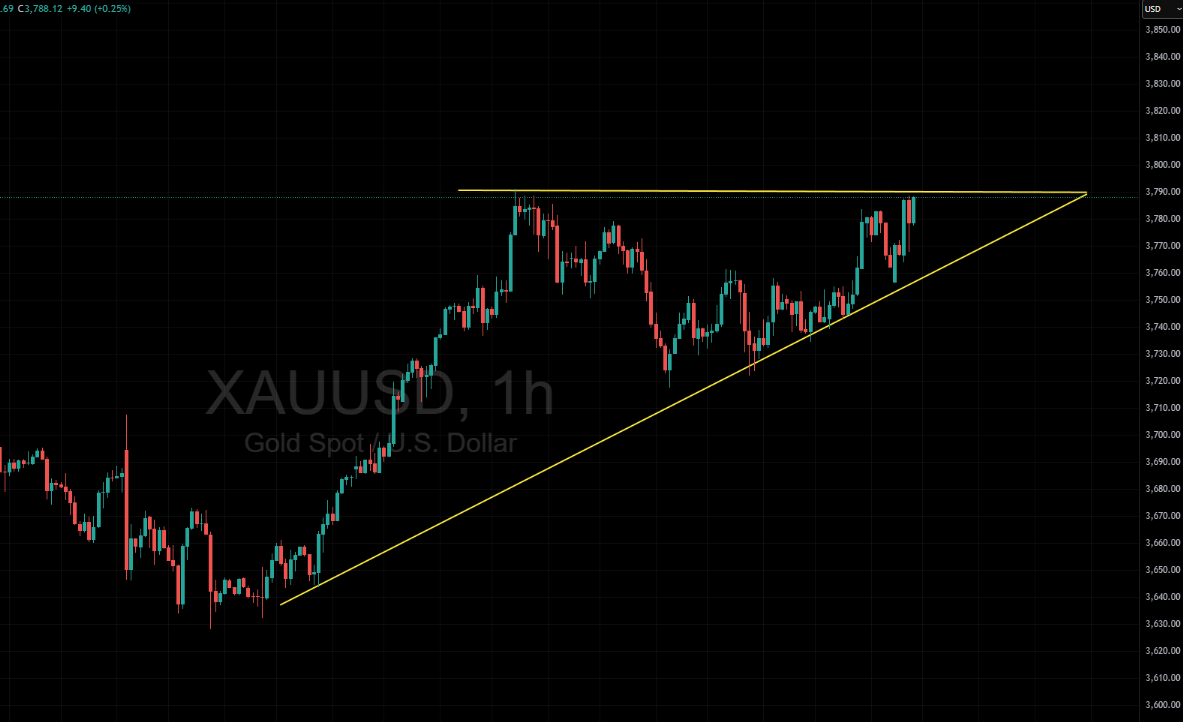
Gold Price Forms Ascending Triangle – XAUUSD Eyeing Breakout Above $3,800
Gold (XAUUSD) is consolidating within an ascending triangle pattern on the 1-hour chart. The price is making higher lows while repeatedly testing the $3,800 resistance zone, signaling strong buying pressure.
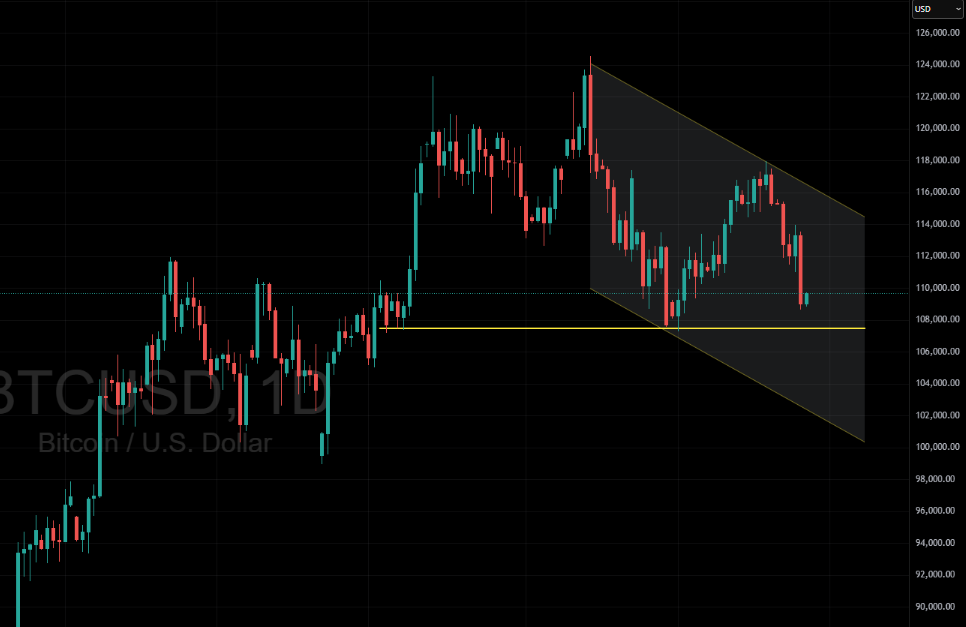
Bitcoin Price Analysis: BTC/USD Testing $110K Support Inside Bearish Channel
Bitcoin (BTC/USD) continues to trade within a downward channel, facing renewed selling pressure near the $114,000 resistance zone. Price action has respected the descending channel structure, with bears pushing the market lower after multiple failed attempts to break above.
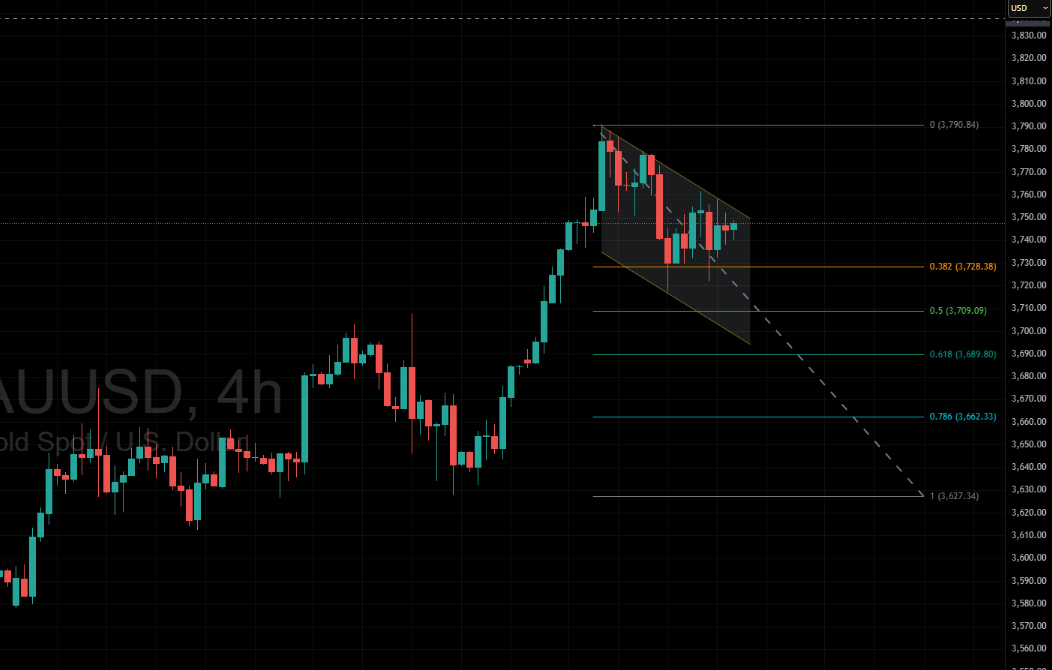
Gold Price Forecast: Bearish Channel Signals Potential Retracement Toward $3,627
Gold (XAUUSD) on the 4-hour timeframe is currently consolidating inside a descending channel after a sharp bullish rally. The price action suggests a potential corrective phase as sellers defend the $3,780–$3,790 resistance zone.
Why Learn with TheCalculatedTrade?
Our educational content is designed to be practical, actionable, and relevant to real-world trading scenarios. We cover technical analysis, fundamental analysis, risk management, trading psychology, and tailored strategies across cryptocurrencies, stocks, and forex.
Whether you are a beginner learning the basics or an experienced trader refining advanced techniques, TheCalculatedTrade provides reliable resources to empower your trading journey and help you make informed financial decisions.